In the short run, which “is a time frame in which the quantity of at least one factor of production is fixed” (Parkin 2010, p.214), the demand for oil is inelastic because there are no readily available substitutes to using oil as a source of fuel or energy.
For example, if the price of petrol were to increase, a person can not easily convert their car so that it runs on another fuel source.
They may choose to drive less, thereby decreasing quantity demanded, but most likely would not drive twice as much if petrol prices were to halve.
We can demonstrate this price inelasticity using the following example:
It costs John £60 for 60 litres of petrol (£1/litre). Petrol prices now double and it costs John £120 for 60 litres (£2/litre). John chooses to drive less, so only buys 50 litres of petrol.
%∆Q
——
%∆P
10/55 x 100 = 18.18
————————
40/80 x 100 = 50
18.18/66.67 = 0.36
Oil demand is therefore inelastic, because the “percentage change in the quantity of oil demanded is less than the percentage change in price” (Parkin 2010, p.84), giving price elasticity a value between zero and 1.
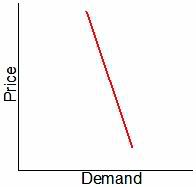
Figure 1 illustrates this inelastic demand curve, and shows that a large price change results in a small change in quantity demanded.
Figure 1 – Inelastic Demand Curve For Oil Price
Short Run Oil Supply
In the short run the supply of oil is also inelastic, and this is largely due to the costs associated with production.
For example, once an oil field has been built, the cost of pumping oil will be the same regardless of whether that oil field is running at 60% capacity or 100% capacity (Goose. 2007).
If oil prices are high then producers may increase production because the marginal cost of producing the oil increases. However, if oil prices are low, producers may decrease production because the marginal cost of producing the oil falls.
Therefore, the amount of oil produced depends on whether oil prices are high enough to cover the marginal cost of production.
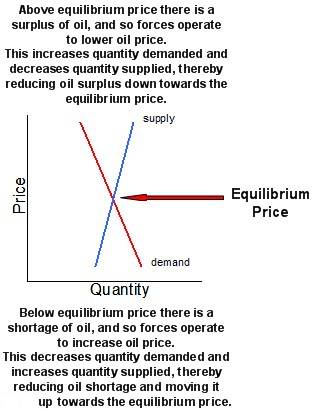
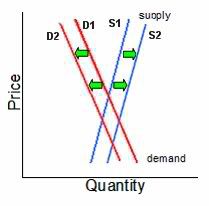
Figure 2 illustrates this supply curve for oil, and shows how a small change in the supply or the demand curve can cause a large change in the market price of oil (i.e. the equilibrium price).
Figure 2 – Oil Equilibrium Price
Short Run Oil Price
During 1973, Arab members of the Organisation of Petroleum Exporting Countries (OPEC) stated that they would stop selling oil to the United States and limit oil production (WTRG Economics. 2009).
Since the majority of the world’s oil was supplied by OPEC, this caused a reduction in the supply curve of oil as shown by figure 3.
Figure 3 – Decrease in Oil Supply
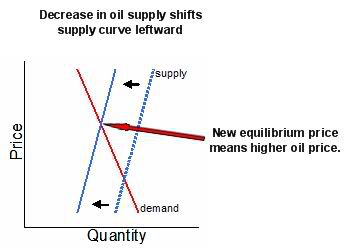
The effect of the oil embargo shifted the supply curve to the left resulting in less oil being supplied at any given price, and a decrease in quantity demanded.
Other Changes
In addition to the producers who supply oil, there are several other factors which can contribute towards the volatility of oil prices.
For example, in 2005 when Hurricane Katrina hit the Gulf coast, oil production in the Gulf of Mexico was severely affected (Esterbrook. 2005).
As a result of this disruption in supply, the supply curve for oil shifted to the left in a similar manner to that shown in figure 3, thereby causing the price of oil to rise.
The increasing demand for oil from rapidly developing nations, such as China, is also having an affect on oil supply and demand (The Becker Posner Blog. 2008).
As these countries industrialise, they demand increasing amounts of oil which then shifts the demand curve to the right as shown in figure 4.
Figure 4 – Increase in Oil Demand
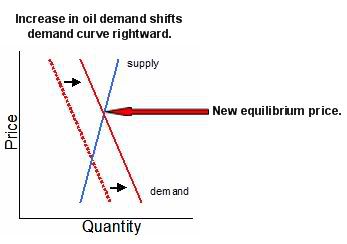
The increase in demand for oil has the same effect as a reduction in supply, that being, the price of oil responds sharply to an increase in demand.
Long Run Forecast
In the long run, which “is a time frame in which the quantity of all factors of production can be varied” (Parkin 2010, p.214), oil demand and supply are elastic.
Hurricane Katrina for example, did not cause people outside the affected area to drive less or use less oil in general.
However, if people believe that oil prices will continue to rise in the future, there will be a change in the long run demand and supply curves as people look for substitutes to oil.
A good example of this can be found with the changing attitudes towards oil consumption after the oil crisis in the 1970s.
Nations such as France, for example, began phasing out the use of oil fired power stations and started replacing them with coal or nuclear powered stations (Source Watch. 2008).
Such global measures shifted the demand curve to the left, resulting in less demand for oil and lower oil prices.
In addition to this, the higher oil prices had increased the marginal cost of production which subsequently encouraged oil companies to explore new extraction methods, for example, extracting oil from deep sea waters (The Economist. 2008). Technologies such as these will increase supply and shift the supply curve to the right.
The result is that long run oil prices will be less volatile due to decreased demand and increased supply of oil as shown by figure 5.
Figure 5 – Long Run Oil Supply and Demand
Conclusion
Oil prices are volatile in the short run because demand and supply are inelastic. This is due to the fact that there is a limited supply of oil which means any disruption to supply will shift the supply curve to the left, resulting in a sharp increase in price.
In terms of demand, prices are volatile because at present there are no readily available substitutes to using oil, so an increase in demand, such as from developing nations, will shift the demand curve to the right also causing a sharp increase in price. Oil prices in the short run are therefore very sensitive to changes in demand and supply.
In the long run oil supply and demand is elastic, because future alternatives give the potential for reduced demand and increased supply.
For example, oil supply may be increased through new extraction technologies or the discovery of new oil fields (Mail Online. 2009), which will shift the supply curve to the right and reduce oil prices.
Demand may be decreased through the development of “green technologies” such as hydrogen fuelled cars, thereby shifting the demand curve to the left and lowering oil prices.
Therefore, in the long run, oil prices will be less volatile because if oil prices get too high people will use a cheaper substitute, and when prices rise, producers will supply more oil.
However, such developments take time to implement, meaning that until they are implemented, the price of oil will remain volatile in short run.
Bibliography
Becker, G. The Rise in the Price of Oil-Becker. May 11th 2008. [Online] The Becker-Posner Blog.
Available from: http://www.becker-posner-blog.com/archives/2008/05/the_rise_in_the.html [Accessed 22 November 2009]
Esterbrook, J. (2005). Katrina Wreaks Havoc On Oil Market. CBS News [Online]
Available from: http://www.cbsnews.com/stories/2005/08/30/national/main804787.shtml [Accessed 22 November 2009]
Goose, P. The Oil Drum (2007) The Economics of Oil [Online].
Available from:
http://www.theoildrum.com/node/2899 [Accessed 22 November 2009]
Mail Online (2009) BP strikes “giant” oil well in Gulf of Mexico [Online].
Available
from: http://www.dailymail.co.uk/news/worldnews/article-1210691/BP-strikes-giant-oil-Gulf-Mexico.html [Accessed 22 November 2009]
Parkin, M., Powell, M. and Matthews, K. (2010). Microeconomics. 7th ed. Pearson
Education, pp. 214
Parkin, M., Powell, M. and Matthews, K. (2010). Microeconomics. 7th ed. Pearson
Education, pp. 84
Source Watch. France and Coal. 2008. [Online].
Available from
http://www.sourcewatch.org/index.php?title=France_and_coal [Accessed 22 November 2009]
The Economist. Double, double, oil and trouble. May 29th 2008 [Online]
Available from: www.economist.com/displaystory.cfm?story_id=11453090&CFID=20461664&CFTOKEN=64012380 [accessed 22 November 2009]
WTRG Economics. 2009. [Online].
Available from http://www.wtrg.com/prices.htm
[Accessed 22 November 2009]
Reviewed – 27th March 2016